“There’s that sort of sense that many technical people will see or feel when you see something and you know what it could be, and you know it could be important, and you see companies just doing it wrong — there’s that powerful desire to fix it and do it right and show them sort of how it’s supposed to be done”
Ever since its release in 2015, Batman: Arkham Knight has had a terrible performance profile. The initial release had absolutely horrid performance that was best covered by a Total Biscuit video in which he described seeing “hitching and frame-rate drops, especially when driving or flying fast around the city”, and that wasn’t an isolated experience — the situation got so bad that the PC version was removed from sale.
The game later returned to retail with an update which Digital Foundry covered in a 2015 video and found to be neither good-enough nor efficient: hitches and stuttering were still around, and the GPU was far from being fully utilized. Digital Foundry revisited Arkham Knight again in a 2018 video, with the video title calling it “One of PC’s Worst ports” and the intro voice-over referring to it as “The dreaded PC version” — and then again in a 2019 video covering the re-release on the Epic Games Store which comes sans DRM. Richard Leadbetter even calls Arkham Knight’s performance “a puzzle [he’s] been trying to crack for years now”. I liked the game a lot yet suffered from its performance even on top-tier hardware — and technical puzzles, especially ones related to game performance, captivate me. So I decided I’d take a stab at this one. FWIW, all my work has been with the GameWorks effects turned off.
The fact that the GPU isn’t fully utilized pointed a finger towards the CPU-side code, and the stutters being associated with traversing the world via gliding or the Batmobile made the game’s streaming system the primary culprit, so I decided to investigate further. This turned out to be more difficult than usual — I have the DRM-laden Steam version, and it seemed to resist any frame capture tools I throw at it like Renderdoc et al. I still wanted to know how the CPU is spending its time, so I decided to get a bit creative.
I grabbed the source code for ReShade, which implements a layer that intercepts Direct3D 11 API calls, and integrated the Tracy Profiler into it, so I can get an idea of what API calls the game’s making and how much time it spends in each of them. That worked beautifully, and while I wasn’t able to hook the DXGI Swapchain’s Present() call and get accurate per-frame timings, I was able to see the D3D11 calls and I immediately saw a giant red warning flag:
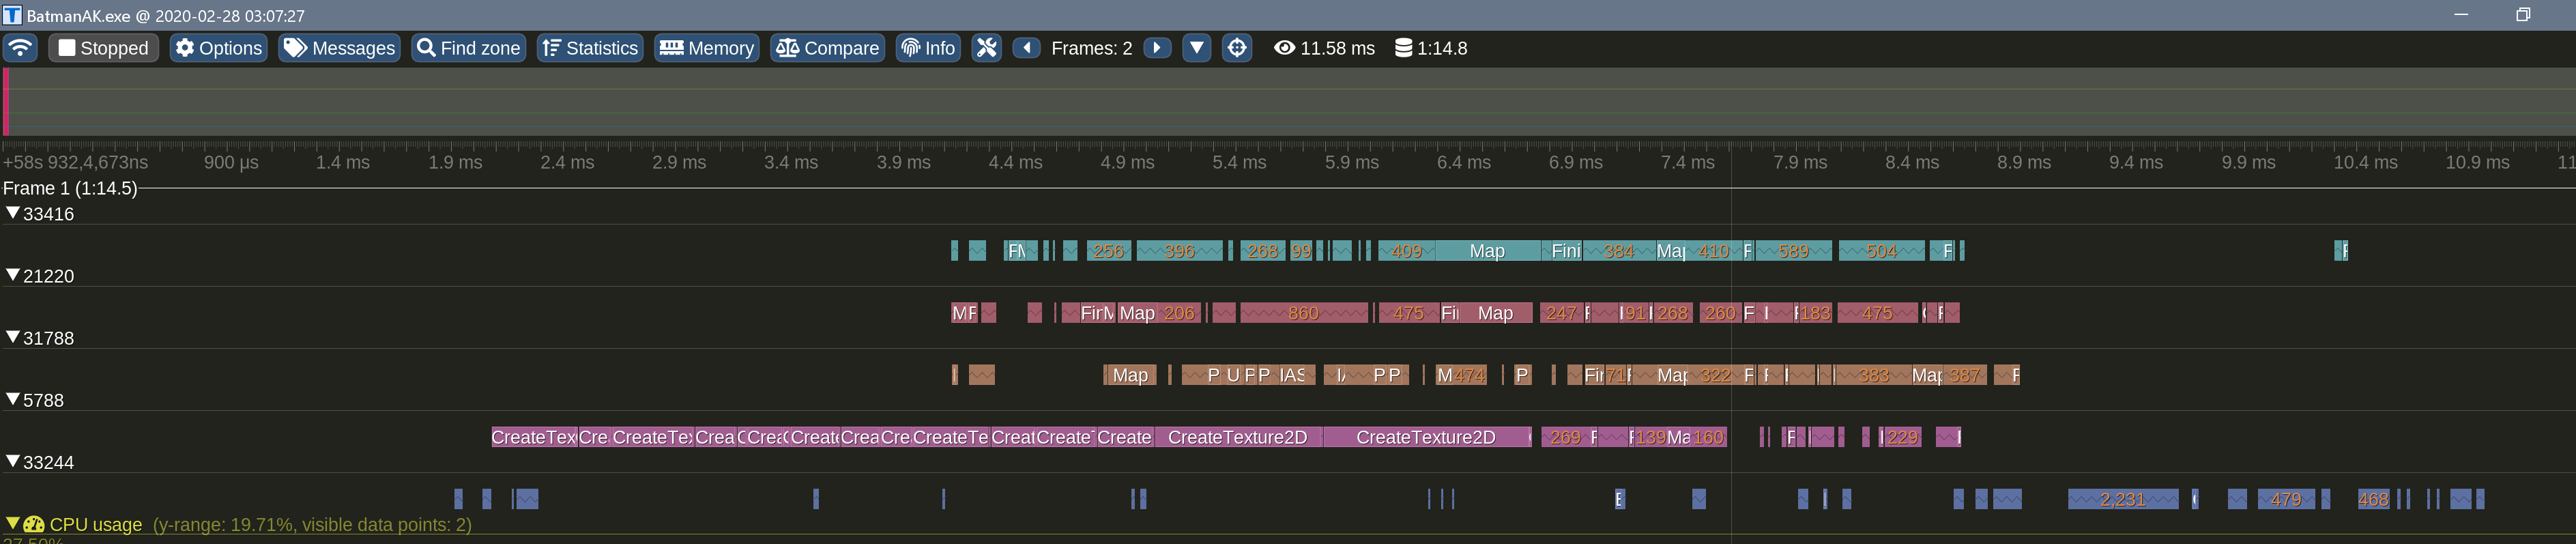
There were a few CreateTexture2D() calls taking over a millisecond each:
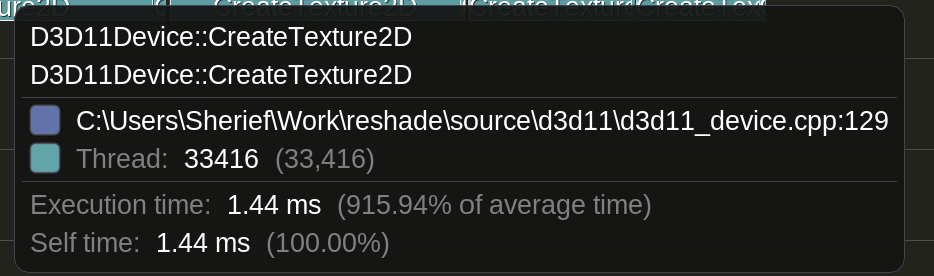
When a 60 FPS framerate allocates an ~= 16 milliseconds budget for the entire frame this is quite a problem. Tracy gathers aggregate statistics, and inspecting them revealed that CreateTexture2D calls taking a long times are quite frequent. Another smoking gun potentially pointing to the streaming system, but I still wanted to check one more data point.
I added code to wrap the 2D texture objects and track their lifetime, in addition to tracking the number of texture creation calls, and the results were interesting:
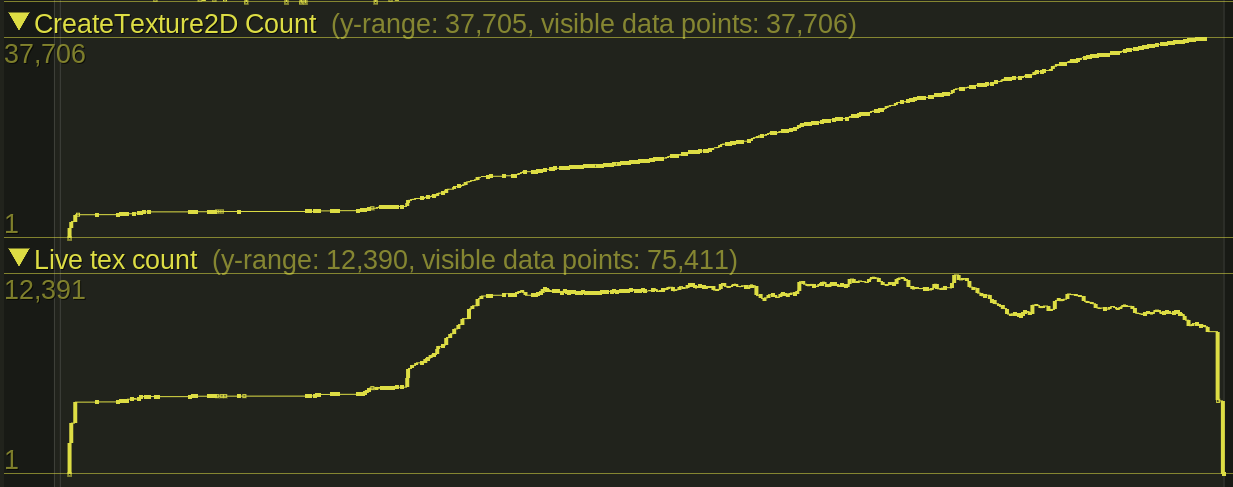
The game hovered around 11,000 live textures at any one time, but the number of CreateTexture2D() calls kept climbing — an indication that the streaming system is almost certainly never recycling texture objects, which is a big no-no. While an efficient streaming system would maintain a pool of textures to reuse and update as the player moves through the open world, this system just kept calling into the graphics driver again and again asking for new textures and almost certainly causing a ton of fragmentation in the process.
I wanted to see how much this lack of texture reuse is hurting performance, and since I was already wrapping D3D device and texture objects it was relatively simple to implement a texture pool. I decided to skip the actual updating of texture contents until I could see what kind of performance impact this strategy would achieve, so all I added was a quick-and-dirty pooling strategy that matches texture descriptions exactly and ignores the pInitialData argument of ID3D11Device::CreateTexture2D.
The performance improvement was dramatic — even with a very naive implementation of a texture pool, moving around the city was a lot smoother than what I was used to, so that direction looked promising. Skipping the initial data upload lead, unsurprisingly, to some image corruption, and the next step was to fix that and see whether the performance improvement remains. On the bright side, some of the corruption was fun to watch:

I ended up copying the initial data provided at the time of CreateTexture2D() call, then flushing it to the actual texture via a call to ID3D11DeviceContext::UpdateSubresource before executing any draw calls. My first implementation used a deque and allocated memory once for every CreateTexture2D call, and even with this amount of overhead most of the stutter was gone; as expected this fixed the visual corruption issues. I later moved to using a preallocated area of system memory with a linear allocator — that way no calls to malloc() would be happening in the middle of asset streaming: this seemed to fix the remaining stutters related to texture uploads.
Buffers exhibited similar behavior to textures, but the impact on performance wasn’t as bad. Still, a pooling system (as inefficient as the one I ended up using is) fixed more stutters, and at that point I was able to play the game at a near-locked 60 FPS as long as my GPU can actually push the pixels on screen — which is quite the dramatic change from how things have been since, well, forever.
There’s still some low-hanging fruit to be picked: my pooling code matches on exact texture description, so an RGBA8_UNORM texture cannot be used to satisfy an RGBA8_SRGB allocation — converting to typeless DXGI formats before pooling would be a straightforward improvement to make, and based on the data I already have it would improve the number of pool hits. The buffer pooling code is even worse, matching on the exact buffer size, where a much better strategy would be to pad buffers to the nearest multiple of N kilobytes, then basically have multiple buckets with each bucket fit to satisfy all allocation requests within a certain size range. But at this point my incentive isn’t as high since I was able to get to the point of being GPU-bound merely by throwing more than enough CPU, RAM, and VRAM at the problem given the newer hardware I have now.
I was blown away, and quite a bit disappointed, by the fact that such a straightforward optimization (implemented in under a week) was able to get such a dramatic performance improvement in a game this notorious for bad performance. I wonder how the people responsible for this implementation found it acceptable, and whether they realize how much money was thrown away by something that could’ve been fixed in a single man-week of work. I argue a lot for craftsmanship-for-craftsmanship’s-sake, and I realize how that usually doesn’t make financial sense, but in this case a little attention and care could have saved the publisher millions of dollars in actual costs, and only god-knows-how-much in reputation and goodwill. Sloppy engineering has a cost, good craftsmanship has actual value, and the next time someone is allowed to ship something this terrible we might not be lucky enough to be able to develop such a fix.
The fix is available in this drop-in replacement DXGI dll — to use it just copy the dxgi.dll file to the same directory as BatmanAK.exe, the game’s executable, and be sure to disable all GameWorks effects and any overlays other than the Steam overlay as some overlays are known to cause crashes. The source code for my changes is available in the batman branch in this git repo.
Update: In case you run into crashes with this, it should generate some .dmp files in the same directory as the DLL. Share the dump files with me and I’ll do my best to investigate the issue.