I was writing some game networking code when all of a sudden Visual Studio was becoming increasingly non-responsive as more networking events occured. My first reaction was to pull out UIforETW and attempt to figure out what’s going on in Visual Studio and the system overall to cause this slowdown. And I spotted this smoking gun in Windows Performance Analyzer:
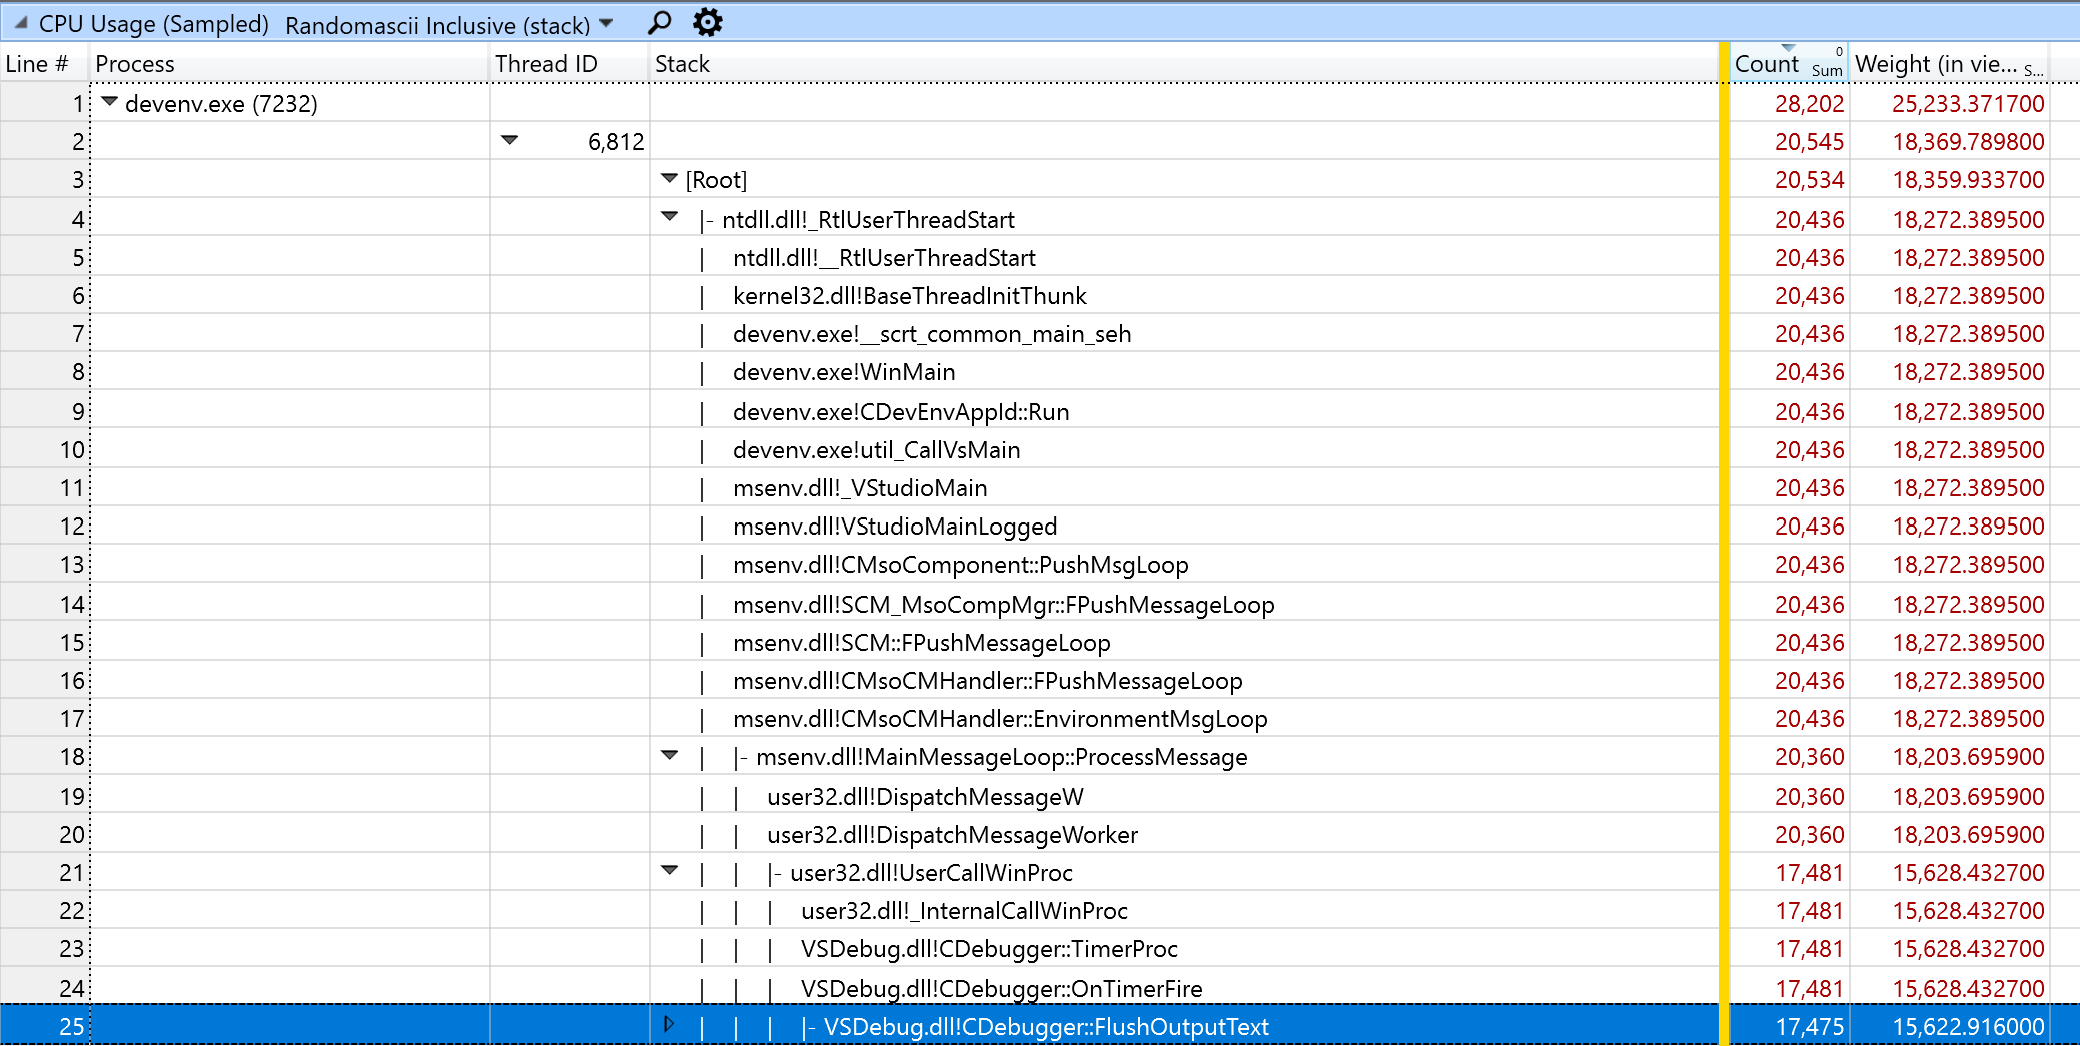
A lot of time was being spent flushing output, and I was using OutputDebugString() for debugging in some of the lower-level code. Looking at the Output window in Visual Studio I noticed something interesting: long lines consisting almost entirely of ÌÌÌÌÌÌÌÌÌÌÌÌÌÌÌÌÌÌÌÌÌÌÌÌÌÌÌÌÌÌ. This is one of those values you recognize if you’ve spent enough time in the trenches, as it maps to 0xCC - the x86 opcode (single-byte variant) for int 3 to break into the debugger. The debug C Runtime Library uses patterns like this to identify properties of certain regions of memory, like whether they’ve been newly allocated or freed, and 0xCC is used to fill stack buffers since attempting to execute it will result in a debugger break.
The next step was to put breakpoints in both variants of the function, OutputDebugStringA() and OutputDebugStringW(), and among the first breakpoints was one where I instantly realized where my oversight was:
auto fn = [](const char* format, ...) -> int
{
    va_list args;
    va_start( args, format );
    char buffer[4 * 1024];
    //vsprintf( buffer, format, args );
    OutputDebugStringA(buffer);
    va_end( args );
    return 0;
};
netcode_set_printf_function(fn);
netcode_set_printf_function() is part of the netcode.io networking library, and here I was passing it a replacement for printf() to use for printing debug data. At one point I commented out the actual vsprintf() call, and so I was outputting the value in buffer - which is entirely uninitialized memory. Changing the declaration in the code to char buffer[4 * 1024] = {}; fixed the issue, so that confirmed my hypothesis. It’s a silly error on my part but it made debugging in Visual Studio too slow to be even borderline usable, and I thought I’d share this in case someone else falls into the same trap of passing uninitialized memory to OutputDebugString().
In the words of a latter-day nihilist philosopher, “I HAVE NO TOOLS BECAUSE I’VE DESTROYED MY TOOLS WITH MY TOOLS”.